Pubmed is a phenomenal resource. With over 30 million publications, it is perhaps the biggest online literature collection. However, making sense of all that information has become an almost insurmountable challenge.
Because of the unyielding pressure of the publication firehose, we now rely on content curators to parse what is happening in our field of interest. At the top level, these curators are the journals themselves. For example, if something is published in Nature, it is probably worth reading. At the next level, we have review articles in which KOLs research and summarize the information for us. Finally, we have our friends and colleagues, who occasionally point us to a “really cool” article they found.
Unfortunately, the curation model has its own challenges. Because we rely on others to distill the content, we inherit their biases. We also lose track of how scientific knowledge changes over time and across researchers and institutions. Finally, despite our best efforts, we can only scratch the surface of the totality of ideas in a vast research area, such as oncology.
So, how can we better track the current state of our collective knowledge and better understand how it changes through time and space?
Here, I apply a state-of-the-art machine learning algorithm developed at Google to make sense of about 50’000 scientific abstracts published in the top 10 oncology journals over the last 10 years.
Getting the publications
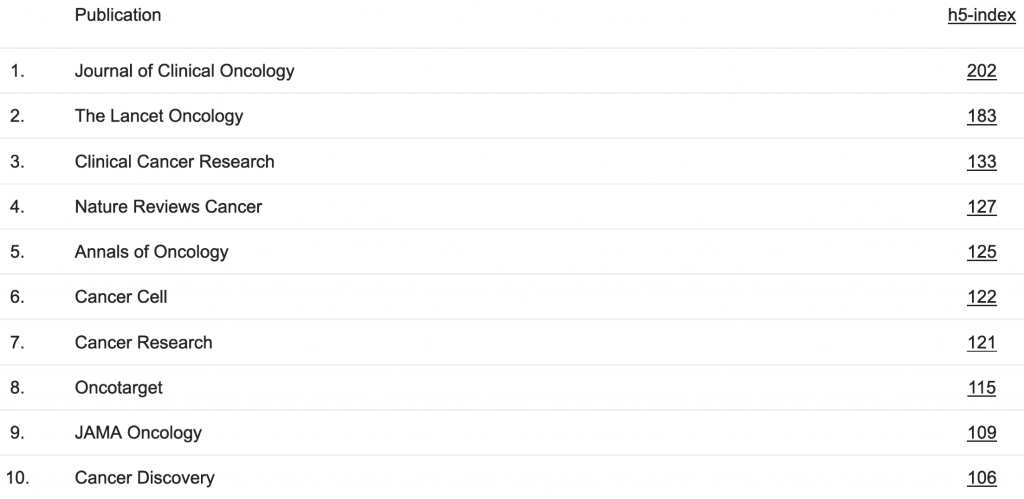
Since I began this analysis during the ASCO conference, I started by looking at the top 10 oncology journals:
Table 1. Most-cited oncology journals
For these journals, I pulled all available abstracts from the last decade. It amounted to about 50’000 texts:
Figure 1. Number of downloaded abstracts (5/25/2011 – 5/25/2021)
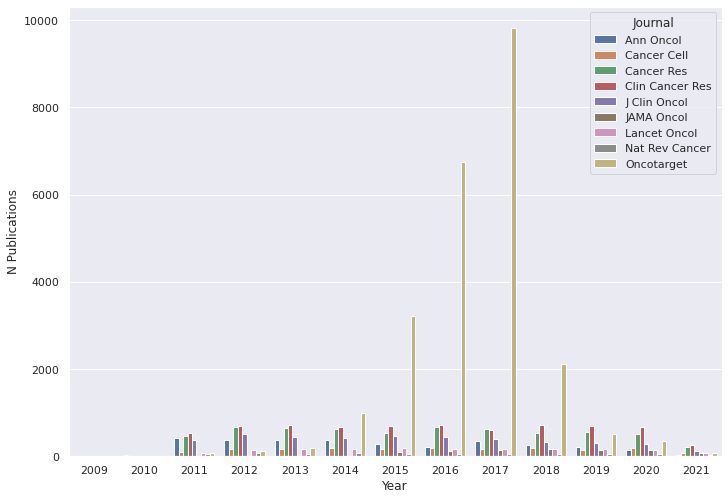
As you can see, the number of Oncotarget publications skyrockets between 2015 and 2018. In fact, almost half of all downloaded abstracts were from Oncotarget. I am not sure if it has absorbed other journals or published a lot between 2015 and 2018. But for now, I decided to analyze the data from Oncotarget and other journals separately so as not to bias the analysis results.
Word embedding
To analyze the texts, I used BERT. BERT is a state-of-the-art algorithm for natural language processing (NLP) developed at Google. Like its predecessor, word2vec, BERT assumes that words appearing in a similar context tend to have similar meanings and can be represented by similar vectors in a numeric space. BERT learns this vector representation by training an artificial neural network on a large collection of texts in a process called word embedding.
As one might expect, word embedding is time-consuming and computationally expensive. Luckily, Microsoft recently published a BERT model, pre-trained on tens of millions of Pubmed abstracts and full-text articles. Thus, I did not have to train my model from scratch. All I had to do was use a pre-trained one from Microsoft to transform my measly 50 thousand abstracts into numeric vectors.
Topic discovery
Having numeric word representations allows clustering algorithms, such as HDBSCAN, to model each abstract’s topic. The resulting topics can be identified by their word probability distributions. For example, here is Topic no. 71 discovered by the algorithm:
Figure 2. Top word probabilities for Topic 71
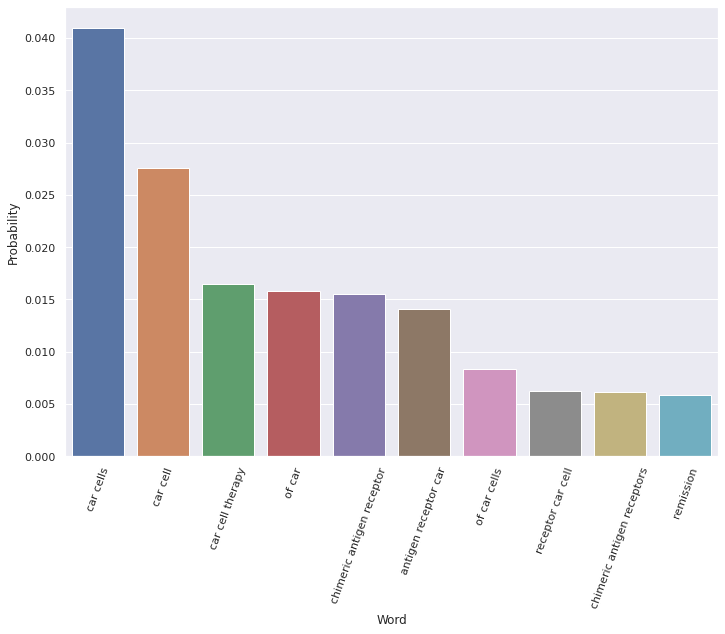
As you can see, most of the top words (e.g., “car cells,” “chimeric antigen receptors”) are unambiguously related to CAR-T therapy. Interestingly, the 10th most probable word for this topic (see far right, Figure 2) is “remission.” This means that the concept of remission is likely often discussed within the context of CAR-T.
Mapping topics
The clustering algorithm used to discover topics is unsupervised, allowing for an organic discovery of topics while limiting pre-existing human biases. Here is a two-dimensional representation of all the 355 topics identified by the algorithm:
Figure 3. Intertopic distance map
The above map is interactive. You can mouse over the topics to see the top few words and use the bottom slider to find specific topics (e.g., Topic 71 discussed above). You can also use your mouse to zoom in on specific parts of the map and see the neighboring topics near your topic of interest. Double-clicking on the map will return you to the original scale.
Zooming in on Topic 71, you will see that the closest two topics are Topic 69 (“Ibrutinib,” “CLL,” “BCR,” etc.) and Topic 275 (“HSP90,” “HSP90 inhibitors,” etc.). Though it is not obvious why the algorithm considers these topics semantically close with CAR-T, I believe the logic could be that all three topics pertain to treating hematological malignancies.
The number of identified topics can be tuned, using more or less granular algorithm settings. For example, in my analysis, I originally identified 627 topics, which I reduced to 355 by unifying topics within a certain threshold of each other in the vector space. Thousands of topics could be identified using more liberal algorithm settings. Of course, the more topics you discover, the noisier the analysis becomes unless you can increase the amount of input data, i.e., feed more publications in. Thus, the optimal number of topics will likely depend on the amount of data you have and the goals of your analysis.
Searching topics
Of course, when you have hundreds or thousands of topics, it is impractical to use the intertopic distance map (e.g., Figure 3) to search for topics of interest. Fortunately, you can take advantage of having the vector representation of all topics to search for the ones that are semantically related to your keywords of interest. The keywords are embedded into the same vector space using the same AI model, and topics within a certain distance of these keywords are returned in a human-readable form. For example, here are the top 4 topics returned after searching for “synthetic lethality” in this way:
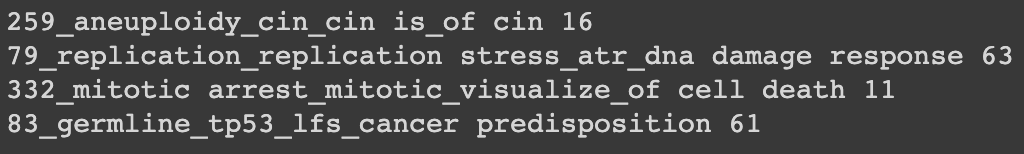
Topic 79 above is clearly spot on, as ATR and other targets within the DNA Damage Response pathway are some of the most studied within the synthetic lethality paradigm. A quick Google search on other topics (e.g., “aneuploidy,” “chromosomal instability,” “mitotic arrest,” or “TP53”) confirms that these concepts are also often talked about within the synthetic lethality context.
Topics over time
Having identified what the main oncology themes are, we can analyze how they have evolved. For example, here is the topic evolution graph for the four synthetic lethality topics:
Figure 4. Synthetic lethality topics over time
The above graph is interactive. You can mouse over specific points on the graph to see what the top words were for a particular topic at a point in time. You can also isolate specific topics by double-clicking on topic names at the bottom of the graph. Double-clicking on the legend area will return the graph to its original view.
Note that the ideas of replication stress (Topic 79) and aneuploidy (Topic 259) seem to dominate the other two topics within the overall synthetic lethality theme (Figure 4). Moreover, the discussion of mitotic arrest (Topic 332) appears to have extinguished completely around 2018. Of course, the dataset is likely too small and the analysis too noisy to draw definitive conclusions.
Detecting trending topics
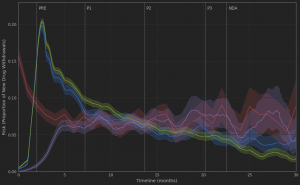
Here, I tried to identify topics that seem to be trending up in popularity (note that these are not necessarily popular topics but ones that grew in popularity over the last few years):
Figure 5. Trending oncology topics
An obvious observation is that approved PD-1/PD-L1 inhibitors and TKI drugs still occupy a lot of oncologists’ attention. However, a novel target, EZH2, appears to have rapidly resurged in popularity over the past year (possibly driven by the Tazverik approval). Furthermore, a couple of new topics have emerged between 2016 and 2017. These include the discussion of Tumor mutational burden (TMB) within the context of Immune checkpoint inhibitor (ICI) therapy, as well as fusion genes and the use of NTRK inhibitors in the treatment of Desmoplastic small round cell tumors (DSRCT).
From here, I will leave it to you to play with the graph and see if you can find any topics of interest or any evolutionary patterns of note. Remember that you can isolate a specific topic by double-clicking on a specific name in the graph legend and see how that topic has evolved by hovering your mouse over the graph. Double-clicking anywhere on the legend will return you to the original graph view.
Comparing journals
As promised, here is the comparison of the top oncology topics between Oncotarget and other journals:
Figure 6. Top oncology topics (Oncotarget vs. other journals)
As before, you can get more info about the topics by hovering your cursor over the graph.
Using this methodology, it is also relatively easy to map research institutions, geographies, or even principal investigators in terms of the main topics of their published works and the evolution of these themes.
Ideas for future studies
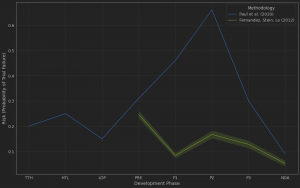
One of the most intriguing aspects of temporal analysis is the ability to analyze how a particular health technology evolves from a basic science discovery to an approved drug. In 2018, a group of top Novartis scientists published an article in Science Translational Medicine, estimating that this cycle took about three decades for most of the important medicines used today. It would be interesting to see how a scientific idea rises and falls in popularity during those 30 years and if there are any generalizable lessons to be learned.
For example, pembrolizumab, which, together with other PD-1/PD-L1 inhibitors, is rumored to become the top-selling drug class of all time, has entered clinical trials 19 years after the initial PD-1 discovery in 1992. For 20 years, no one much cared about PD-1 (or immuno-oncology for that matter) until pembrolizumab demonstrated its therapeutic potential in the clinic. In contrast, the first STING agonist began trials relatively quickly (8 years from the original discovery), but the early enthusiasm for the target has been curbed by clinical failures of the first-generation drugs. It begs the question: how much time and resources are needed to fully understand the target biology and design an appropriate therapeutic agent?
Final thoughts
Scientific knowledge is not a simple aggregation of past discoveries. As demonstrated here, our understanding of molecular pathways and their roles in disease biology constantly changes. Thus, scientific knowledge is more of a running train rather than an endless railway. Knowledge is what we think we know today. But sometimes, an idea we have had 20-40 years ago suddenly resurges in popularity and becomes massively successful. A prime example of that is the wide adoption of mRNA vaccines, precipitated by the COVID-19 pandemic (remember that the first mRNA vaccination attempts date back to the 1980s). This is why it is so critical to understand the movement of ideas through time. Because of the ever-increasing volume of information, it becomes a dimensionality reduction problem, which is why computational linguistics can be so powerful in helping to develop that understanding.
In addition to the scientific knowledge, there is also the social context: the mass of biotech news, political commentary on healthcare, and the BioTwitter firehose. Conversations happening around a scientific topic may be as important to the future of health technology as the topic itself. For example, consider the recent approval of aducanumab. Having the ability to quantify how the FDA’s decision affected the attitudes of various industry stakeholders may help us predict its long-term industry impact. Furthermore, such analysis can be used prospectively to identify key societal attitudes that act as a backdrop to the regulator’s major decision and likely have the power of biasing it.
If you have an idea for an interesting study or a provocative question that can be probed by applying some of the techniques outlined here, I would love to hear from you!